Tag: Dashboard

Using Elasticsearch, Logstash, and Kibana to visualize Apache JMeter test results

In my last blog post I showed how to use Apache JMeter to run a load test against Elasticsearch or anything with a REST API. One of my recommendations was to turn off all of the Listeners so that valuable test client resources are not wasted on aggregating test results. So what’s the best way to analyze your load test results?

Our load test was running against Elasticsearch which just happens to have a pretty nice tool set for ingesting, analyzing, and reporting on any kind of data you might find in a log file. It’s called ELK and it stands for Elasticsearch, Logstash, and Kibana. Elasticsearch is a distributed, scalable search engine and document oriented NoSQL store. Logstash is a log parser that can send log data to various outputs. Kibana is a tool for defining dashboards that contain charts, graphs, and tables based on data stored in Elasticsearch.

It is really quite easy to use ELK to create a dashboard that aggregates and displays Apache JMeter test results in realtime. Here’s how.

Step One: Configure Apache JMeter to Create a CSV File

Another recommendation in my last post was to use the Apache JMeter GUI only for testing and to run your load test from the command line. For example, this runs my test named “Basic Elasticsearch Test.jmx” from the command line and writes the results to results.csv:

/opt/apache/jmeter/apache-jmeter-2.11/bin/jmeter -n -t Basic\ Elasticsearch\ Test.jmx -l ./results.csv

The results.csv file will get fed to Logstash and ultimately Elasticsearch so it can be reported on by Kibana. The Apache JMeter user.properties file is used to specify what gets written to results.csv. Here is a snippet from mine:

(Can’t see the code? Click here.)

Pay attention to that timestamp format. You want your Apache JMeter timestamp to match the default date format in Elasticsearch.

Step Two: Configure and Run Logstash

Next, download and unpack Logstash. It will run on the same machine as your test client box (or on a box with file access to the results.csv file that JMeter is going to create). It also needs to be able to get to Elasticsearch over HTTP.

There are two steps to configuring Logstash. First, Logstash needs to know about the results.csv file and where to send the log data. The second part is that Elasticsearch needs a type mapping so it understands the data types of the incoming JSON that Logstash will be sending to it. Let’s look at the Logstash config first.

The Logstash configuration is kind of funky, but there’s not much to it. Here’s mine:

(Can’t see the code? Click here.)

The “input” part tells Logstash where to find the JMeter results file.

The “if” statement in the “filter” part looks for the header row in the CSV file and discards it if it finds it, otherwise, it tells Logstash what columns are in the CSV.

The “output” part tells Logstash what to do with the data. In this case we’ll use the elasticsearch_http plugin to send the data to Elasticsearch. There is also one that uses the native API but when you use that, you have to use a specific version combination of Logstash and Elasticsearch.

A quick side note: In our case, we were running a load test against an Elasticsearch cluster. We use Marvel to report on the health of that cluster. To avoid affecting production performance, Marvel sends its data to a separate monitoring cluster. Similarly, we don’t want to send a bunch of test result data to the production cluster that is being tested, so we configured Logstash to send its data to the monitoring cluster as well.

That’s all the config that’s needed for this particular exercise.

Here are a couple of Logstash tips. First, if you need to see what’s going on you can add a sysout to the configuration by adding this line between ‘output {‘ and ‘elasticsearch_http {‘ before starting logstash:

stdout { codec => rubydebug }

The second tip is about re-running Logstash and forcing it to re-parse a log file it has already read. Logstash remembers where it is in the log. It does this by writing a “sincedb” file. So if you need to re-parse the results.csv file, clear out your sincedb files (mine live in ~/.sincedb*). You may also have to add “start_position => beginning” to your Logstash config on the line immediately following the path statement.

Okay, Logstash is ready to read the Apache JMeter CSV and send it to Elasticsearch. Now Elasticsearch needs to have an index and a type mapping ready to hold the log data. If you’ve spent any time at all with Elasticsearch you should be familiar with creating a type mapping. In this case, what you want to do is create a type mapping template. That way, Logstash can create an index based on the current date, and it will use the correct type mapping each time.

Here is the type mapping I used:

(Can’t see the code? Click here.)

Now Logstash is configured to read the data and Elasticsearch is ready to persist it. You can test this at this point and verify that the data is going all the way to Elasticsearch. Start up Logstash like this:

/opt/elasticsearch/logstash-1.4.2/bin/logstash -f ./jmeter-results.conf

If it looks happy, go start your load test. Then use Sense (part of Marvel) or a similar tool to inspect your Elasticsearch index.

Step 3: Visualize the Results

Now it is time to visualize all of those test results coming from the load test. To do that, go download and unpack Kibana. I followed a tip in this blog post and unpacked it into $ES_HOME/plugins/kibana/_site on my monitoring cluster but you could use some other HTTP server if you’d rather.

Now open a browser and go to Kibana. You can link to a Logstash dashboard, a sample dashboard, an unconfigured dashboard, or a blank dashboard. Pick one and start playing with it. Once you get the hang of it, create your JMeter Dashboard starting from a blank dashboard. Here’s what our dashboard looked like when it was done:

Apache JMeter Results Dashboard
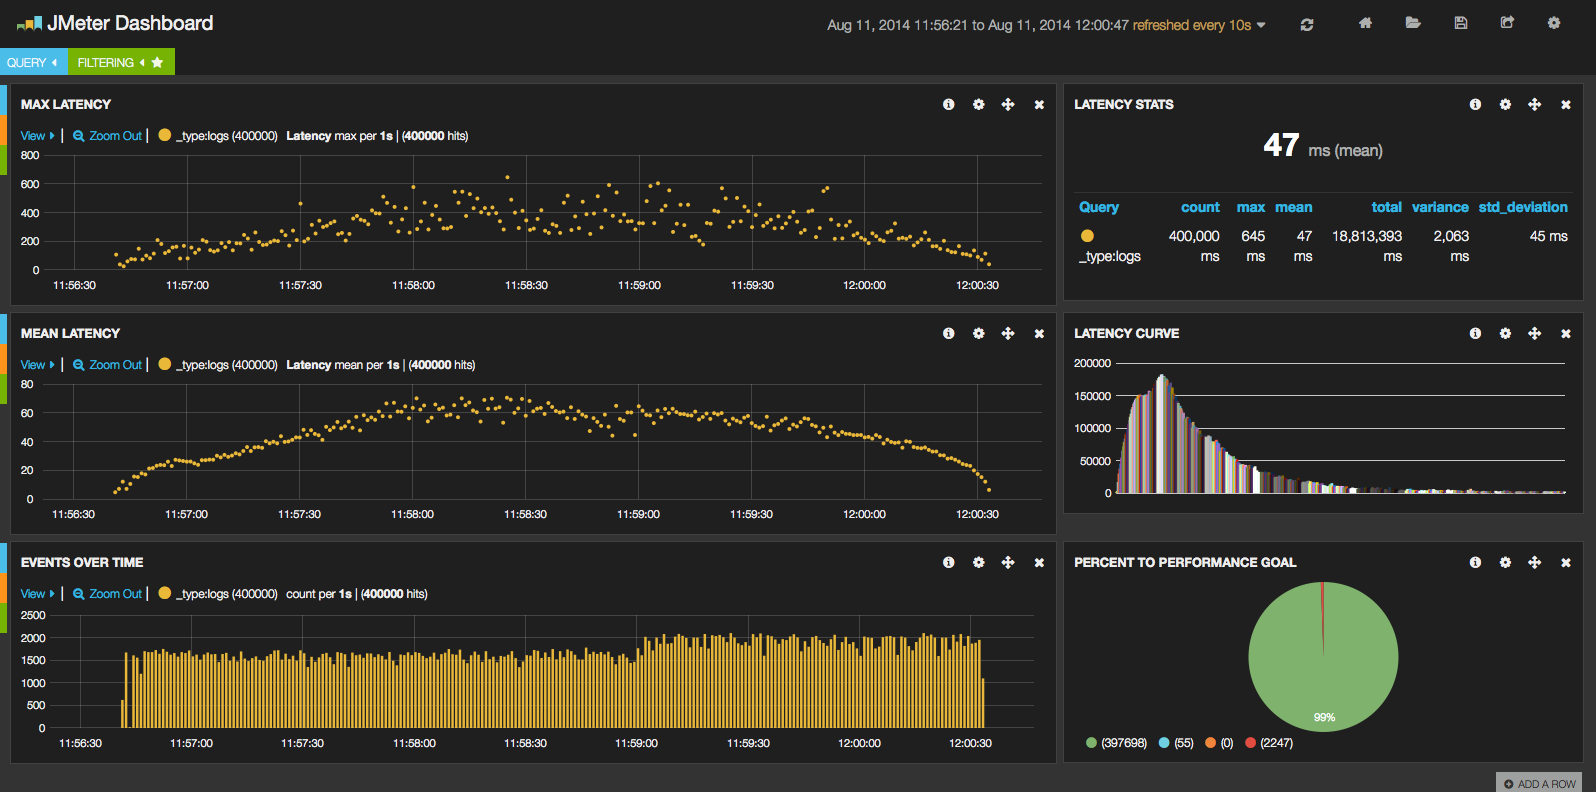
Click to see the screenshot in all of its glory.

Using Logstash and Kibana we can see, in realtime, the throughput our Apache JMeter test is driving (bottom left) and a few different panels breaking down response latency. You can add whatever makes sense to you and your team. For example, we want all of our responses to come back within 250 ms, so the chart on the bottom right-hand corner shows how we’re doing against that goal for this test run.

One gotcha to be aware of. By default, Kibana looks at the Elasticsearch timestamp. But that’s the time that Logstash indexed the content, not the actual time that the HTTP request came back to Apache JMeter. That time gap could be small if you are running Logstash while your test is running and your machine has sufficient resources, or it could be very large if you wait to parse your test results for some time after the test run. Luckily, the timestamp field that Kibana uses is configurable so make sure all of your graphs are charting the appropriate timestamp field, which is the “time” field that JMeter writes to the CSV file.

Workflow Dashboards in Alfresco Share

Metaversant recently had a client with some interesting requirements around workflow. I thought I’d post what we did here and get a conversation going about the various pluses and minuses of the approach and find out what others have done when faced with similar needs.

There are two main buckets of requirements I want to focus on: Workflow Reporting/Dashboard and Folder Monitoring. I’ll talk about Workflow Reporting/Dashboard in this post and Folder Monitoring in the next.

Workflow Reporting/Workflow Dashboard

Workflow Reporting is something I’ve seen quite often and handled differently each time based on what the client is trying to do. Alfresco is pretty sparse on Workflow Reporting (capturing the data and making it easy to report on) and Workflow Dashboarding (presenting a dashboard of running workflows and/or workflow reports in the user interface). By “sparse” I mean there really is none. Recent releases have seen the addition of the “My Tasks” page, but that is limited to what it sounds like: A page listing the tasks the current user is assigned to.

What most people want when they ask for Workflow Reporting is the ability to capture workflow data both before and after a workflow has completed. This is significant because if you do nothing about it, data about running workflows disappears into the ether when the workflows complete. A Workflow Dashboard is the ability to see all workflows assigned to all users or a subset of users and perhaps some historical via Workflow Reports (maybe time started, current task, time on current task, current actor, etc.).

For this particular project, my client really only cared about running workflows, so we didn’t have to worry about capturing workflow stats before the workflow ended–they just wanted to see all workflows, no matter who started them, in a sortable list with a link to the workflow details and the ability to perform batch operations against the workflows (such as selecting all workflows and canceling). The twist, however, was that the client wanted to scope the list of running workflows to the Alfresco Share site they were started in. So if there were two Share sites, A and B, and Site A’s users had started 24 workflows on documents stored within the site while Site B’s users (which may overlap with Site A) had started 35 workflows on Site B documents, Site A’s Workflow Dashboard should show a list of 24 workflows while Site B’s should show 35.

The Solution

When workflow data needs to be persisted beyond the life of the workflow, we’ll typically just create some objects in the content model to persist the data and we’ll write to those objects from one or more actions defined within the business process definition. In this case, that wasn’t necessary.

The problem boiled down to how to capture the specific Share site a workflow was scoped to and, then, how to query for and display that information. Once that was resolved, the data could be displayed on a custom Share page.

I may post the code at some point, but for now, here’s the high-level recipe:

Step 1: Capture the Site ID in a Process Variable

Alfresco jBPM workflows have process variables that can store metadata about a running workflow. And, the workflow API allows me to query against that metadata. So, the first step was to capture which Share site the user was in when they launched the workflow.

To do this, I used the Form Service to define a hidden field on my workflow’s startup form. Then, I overrode Alfresco’s client-side JavaScript StartWorkflow component to add my own code that finds the hidden field and sets it with the Share site’s unique identifier (the Site ID field).

Initially, I used a straight hidden field for this. Later, I came back and created a new custom component that included not only the hidden field, but some additional markup and client-side logic that pulled back additional context about the Share site for that workflow so that when someone viewed the workflow or managed a task, they would know more about the Share site than just its Site ID.

Step 2: Create a web script that returns the workflow metadata

With the Site ID stored in a process variable, the next step was getting the workflow data to the front-end Share tier so it could be displayed in a dashboard. This involved creating a repository tier web script that accepted the Site ID as an argument and returned the data as JSON. There are some out-of-the-box web scripts related to workflows, but they return tasks assigned to the current user and for this I needed all running workflows for a given site ID, so that required a custom web script.

The JavaScript API has come a long way with respect to workflow, but the ability to apply a filter on task metadata isn’t there yet, so that meant my controller had to be Java-based.

The interesting part of that web script controller looks like this:

WorkflowTaskQuery tasksQuery = new WorkflowTaskQuery();
Map<QName, Object> processCustomProps = new HashMap<QName, Object>();
processCustomProps.put(SomeCoWorkflowModel.PROP_RELATED_SITE_ID, siteId);
tasksQuery.setProcessCustomProps(processCustomProps);
tasksQuery.setTaskName(SomeCoWorkflowModel.TYPE_DASHBOARD_TASK);
tasksQuery.setTaskState(WorkflowTaskState.IN_PROGRESS);
List<WorkflowTask> tasks = workflowService.queryTasks(tasksQuery);

This gives us all of the tasks that have the Site ID we’re looking for, but the Dashboard needs more than that–it needs the Workflow Instance for full context. No problem–the Workflow API can handle it. Here’s where the controller iterates overs the tasks and adds the workflows to a List of WorkflowMetadata objects that will get set on the web script’s model:

for (int i = startIndex; i < endCount; i++) {
WorkflowTask task = tasks.get(i);
WorkflowInstance wf = workflowService.getWorkflowById(task.getPath().getInstance().getId());
workflows.add(new WorkflowMetadata(wf, task));
}

One potential gotcha with this approach is that there has to be a task assigned to an actor in order for the workflow to show up in the WorkflowTaskQuery results. If a workflow were sitting on a wait-state, for example, that workflow wouldn’t be returned by the code above. To work around this, the workflows in this solution always queue up a “Dashboard Task” assigned to the initiator to guarantee that all workflows, whether they are currently sitting on a task node or not, always show up in the workflow dashboard.

The view for this web script simply returns the data as JSON, so I’ll spare you the details.

The other web script I wrote for this piece deletes workflows for a given set of workflow IDs. You’ll see where that comes in next, but, again, the logic of that controller (also Java-based) is very straightforward, so on to the next step!

Step 3: Create a custom Workflow Dashboard page

The workflow tasks are tagged with Share Site IDs and a repository-tier web script is in place that knows how to find those tasks and give back the Workflow Instance data as JSON. The final step is to render that as a dashboard. For this, I used standard Surf framework techniques to create a new page called “Workflows”. The page contains a client-side JavaScript component that renders a YUI DataTable. The data source for the DataTable is the web script created in the previous step.

Step 4: Create actions

The specifics for what someone might want to do to one or more workflows displayed in the dashboard varies. For this project, users needed to be able to view the workflow details. Initiators needed to be able to cancel the workflow. Viewing the workflow details is just a matter of building the right URL. Canceling the workflow is a little more involved–I used client-side JavaScript to make repo-tier web script calls to a custom web script that can cancel one or more workflows given the workflow IDs.

To make it so that only workflow initiators can cancel a workflow, I use the same mechanism that document actions uses: The XML configuration file that defines the cancel workflow action specifies that the user must be the workflow initiator. Then, the client-side JavaScript that builds the dashboard actions checks the workflow data to see if that’s the case and hides the link if the current user is not the initiator.

Here’s the XML for the cancel workflow action:
<toolbar>
<actionSet>
<action type="action-link" id="onActionCancel" permission="initiator" label="menu.selected-items.cancel" />
</actionSet>
</toolbar>

The client-side code that checks action permissions is a direct copy of Alfresco’s out-of-the-box logic that does the same.

The Result

Once fully-assembled, the workflow dashboard looks like this:

Workflow dashboard screenshot

In the screenshot, I’ve got multiple workflows selected and have clicked the “Selected Workflows…” link to show that you can cancel more than one workflow at-a-time.

Now you’ve seen a simple workflow dashboard implementation. My next post will be about launching workflows automatically when objects are dropped into a folder.