
I’m helping a client streamline their Web Content Management processes, part of which includes moving from a static publishing model to a dynamic content-as-a-service model. I’ll blog more on that some other time. What I want to talk about today is how we used Apache JMeter to validate that Elasticsearch, which is a core piece of infrastructure in the solution, could handle the load.
Step 1. Find some test data to index with Elasticsearch
Despite being a well-known commerce site that most of my U.S. readers would be familiar with, my client’s site’s content requirements are relatively modest. On go-live, the content service might have 10 or 20 thousand content objects at most. But we wanted to test using a data set that was much larger than that.
We set out to find a real world data set with at least 1 million records, preferably already in JSON, as that’s what Elasticsearch understands natively. Amazon Web Services has a catalog of public data sets. The Enron Email data set looked most promising.
We ended up going with a news database with well over a million articles because the client already had an app that would convert the news articles into JSON and index them in Elasticsearch. By using the Elasticsearch Java API and batching the index operations using its bulk API we were able to index 1.2 million news articles in a matter of minutes.
Step 2: Choosing the Testing Tool & Approach
We looked at a variety of tools for running a load test against a REST API including things like siege, nodeload, Apache ab, and custom scripts. We settled on Apache JMeter because it seemed like the most full-featured option, plus I already had some familiarity with the tool.
For this particular exercise, we wanted to see how hard we could push Elasticsearch while keeping response time within an acceptable window. Once we established our maximum load with a minimal Elasticsearch cluster, we would then prove that we could scale out roughly linearly.
Step 3: Defining the Test in Apache JMeter
JMeter tests are defined in JMX files. The easiest way to create a JMX file is to use the JMeter GUI. Here’s how I defined the basic load test JMX file…
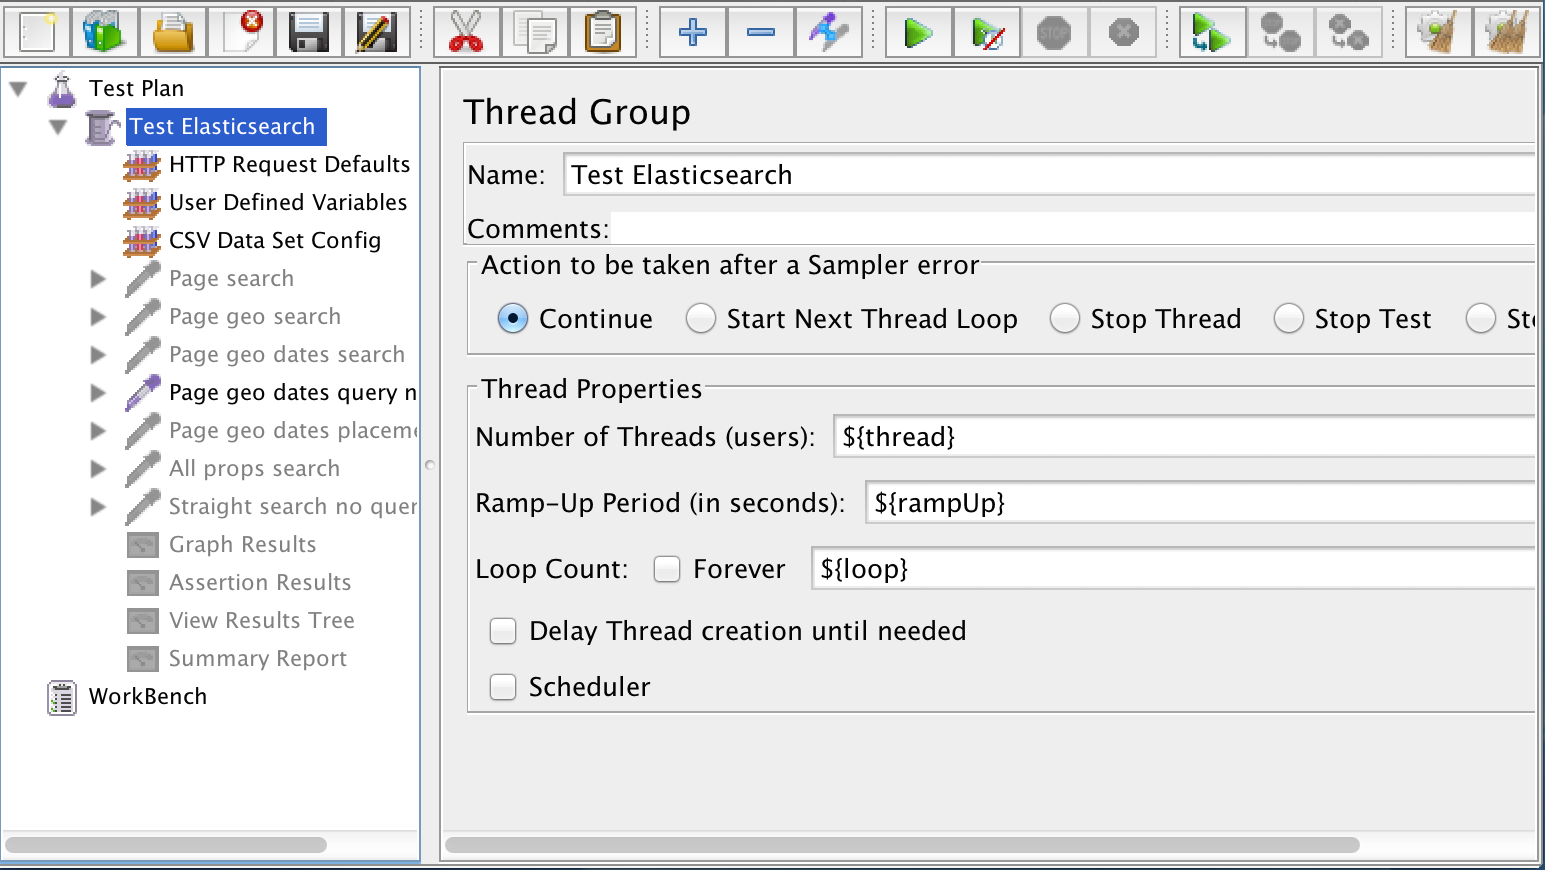
First, I created a thread group. Think of this like a group of test users. The thread group defines how many simultaneous users will be running the test, how fast the ramp-up will be, and how many loops through the test each user will make. You can see by the screenshot below that I used parameters for each of these to make it easier to change the settings through configuration.
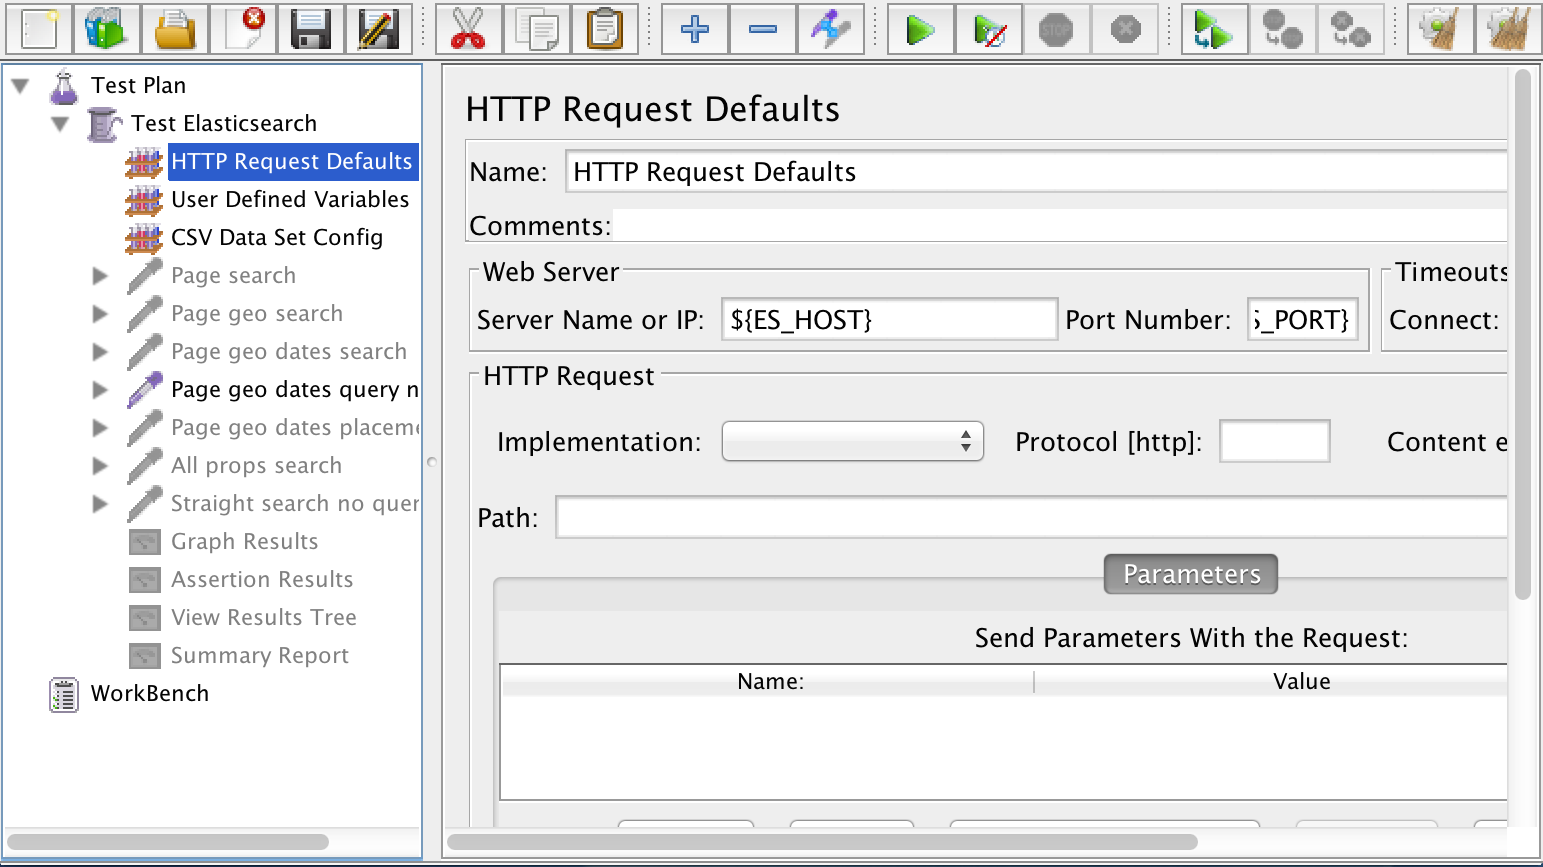
 Within the thread group I added some HTTP Request Defaults. This defines my Elasticsearch host and port once so I don’t have to repeat myself across every HTTP request that’s part of the test.
 Next are my User Defined Variables. These define values for the variables in my test. Look at the screenshot below:
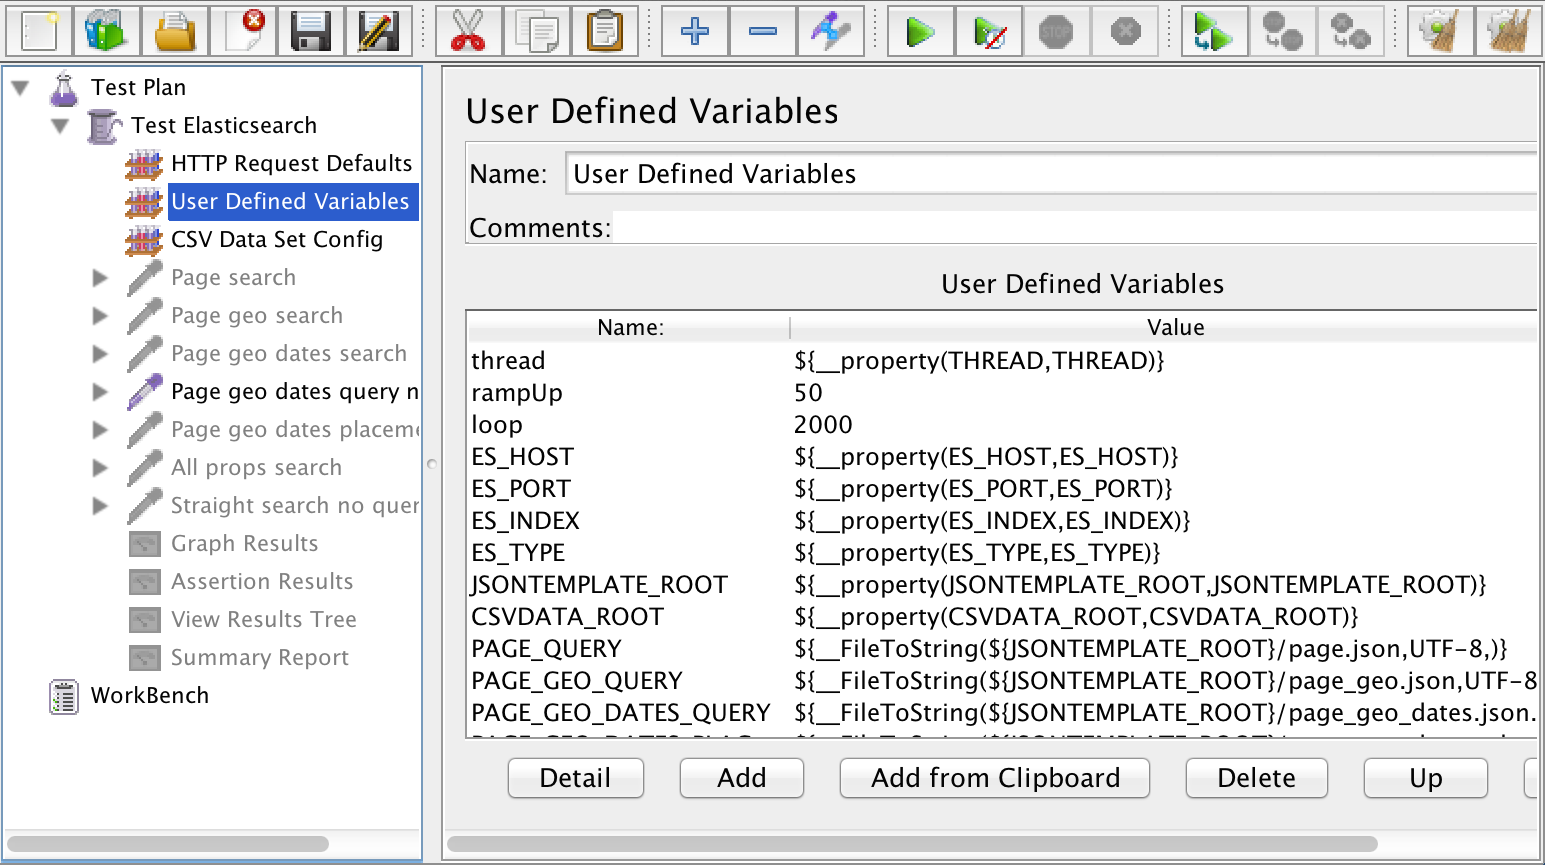 You’ll notice that there are three different kinds of variables in this list:
- Hard-coded values, like 50 for rampUp and 2000 for loop. These likely won’t change across test runs.
- Properties, like thread, ES_HOST, and ES_PORT. These point to properties in my JMeter user.properties file.
- FileToString values, like for PAGE_GEO_QUERY. These point to Elasticsearch query templates that live in JSON files on the file system. JMeter is going to read in those templates and use them for the body of HTTP requests. More on the query templates in a minute.
The third configuration item in my test definition is a CSV Data Set Config. I didn’t want my Elasticsearch queries to use the same values on every HTTP request. Instead I wanted that data to be randomized. Rather than asking JMeter to randomize the data, I created a CSV file with randomized data. Reading data from a CSV to use for the test run is less work for JMeter to do and gives me a repeatable, but random, set of data for my tests.
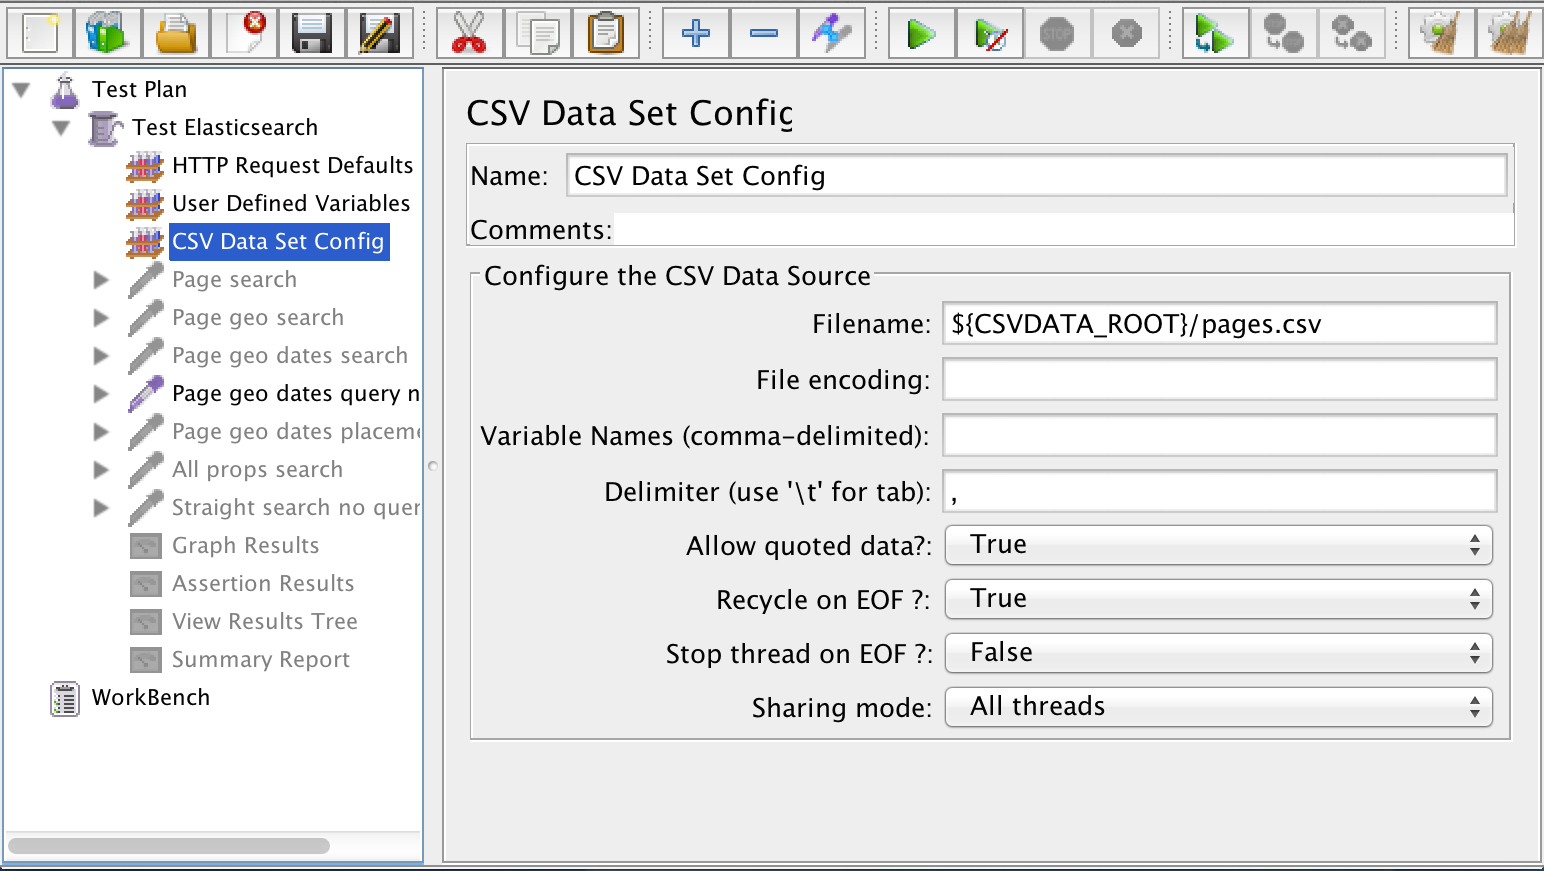 You can see that the filename is prefaced with “${CSVDATA_ROOT}”, which is a property declared in the User Defined Variables. The value of it resides in my JMeter user.properties file and tells JMeter where to find the CSV data set.
Here is a snippet of my user.properties file:
ES_HOST=127.0.0.1

ES_PORT=9200

ES_INDEX=content-service-content

ES_TYPE=wcmasset

THREAD=200

JSONTEMPLATE_ROOT=/Users/jpotts/Documents/metaversant/clients/swa/code/es-test/tests/jsontemplates

CSVDATA_ROOT=/Users/jpotts/Documents/metaversant/clients/swa/code/es-test/tests/data
Next comes the actual HTTP requests that will be run against Elasticsearch. I added one HTTP Request Sampler for each Elasticsearch query. I have multiple HTTP Request Samplers defined–I typically leave all but one disabled for the load test depending on the kind of load I’m trying to test.
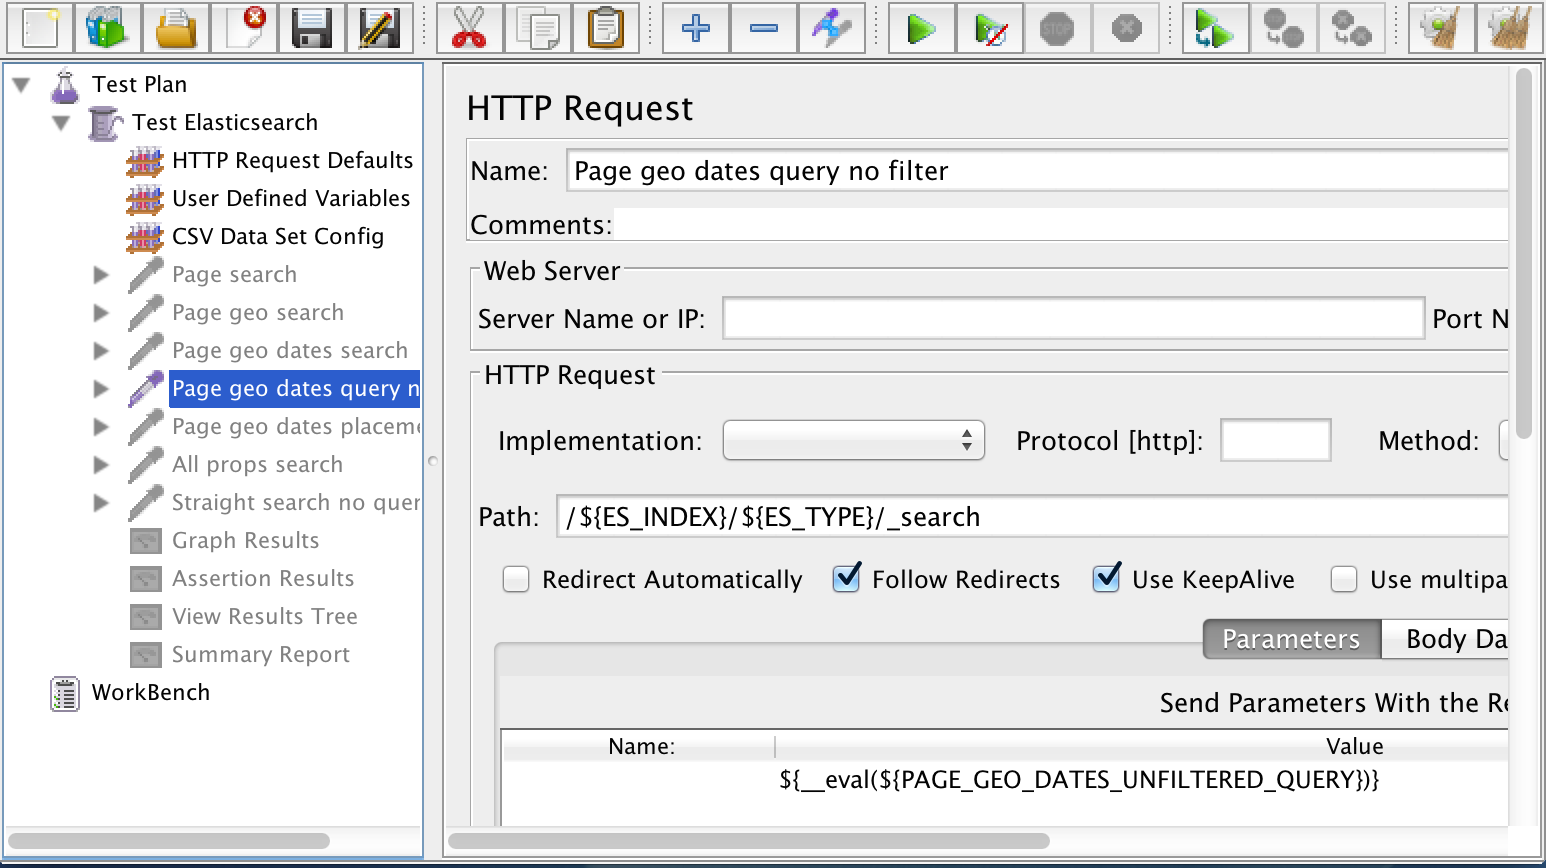 You can see that I didn’t have to specify the server or port because the HTTP Request Defaults configuration took care of that for me. I specified the path, which is the Elasticsearch URL, and the body of the request, which resides in a variable. In this example, the variable is called PAGE_GEO_DATES_UNFILTERED_QUERY. That variable is defined in User Defined Variables and it points to a FileToString value that resolves to a JSON file containing the Elasticsearch query.
Okay, so what are these query templates? You’ve probably used curl or Sense (part of Marvel) to run Elasticsearch queries. A query template is that same JSON with replacement variables instead of actual values to search for. JMeter will merge the test data from the randomized test data CSV with the replacement variables in the query template, and use the result as the body of the HTTP request.
Here’s an example of a query template that runs a filtered query with four replacement variables used as filter values:
(Can’t see the code? Click here)
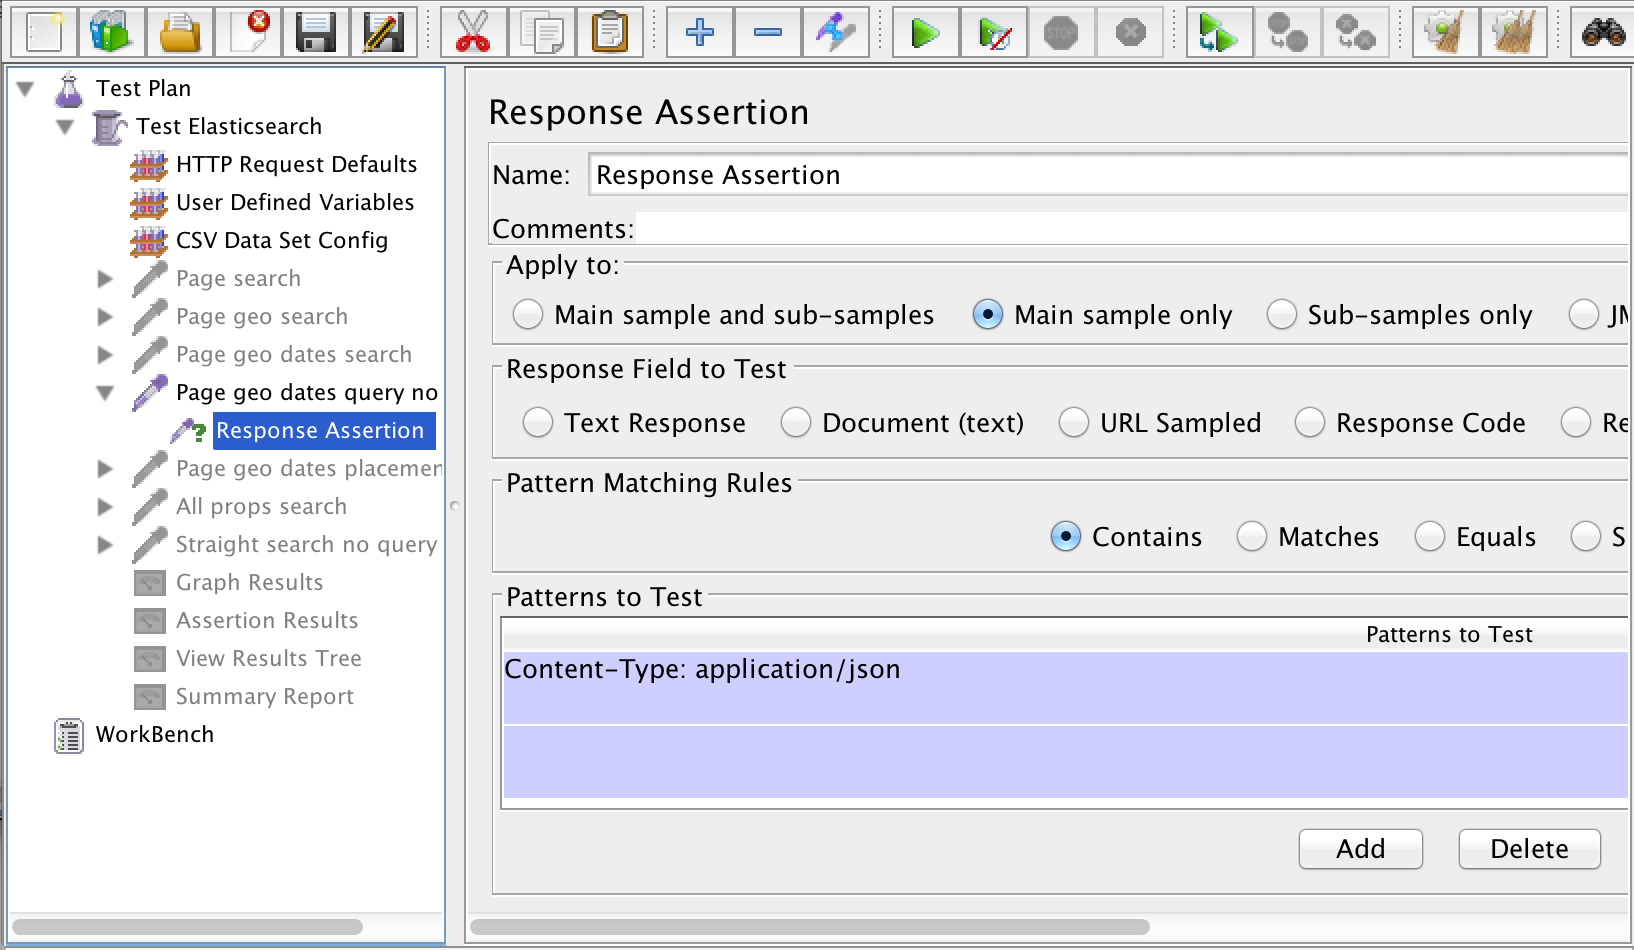
JMeter lets you inspect the response that comes back from the HTTP Request using assertions. However, the more assertions you have, the more work JMeter has to do, so it is recommended that you have as few as possible when doing a load test. In my test, I added a single assertion for each HTTP Request that looks only at the response header to make sure that I am getting back JSON from the server.
 JMeter provides a number of Listeners that summarize the responses coming back from the test. You may find things like the Assertion Results, View Results Tree, and Summary Report very helpful while you are writing and testing your JMX file in the JMeter GUI, but you will want to make sure that all of your Listeners are completely disabled when running your load test for real.
At the end of this step I’ve got a repeatable test that will run 400,000 queries against Elasticsearch (that’s 200 threads x 2,000 loops x 1 enabled HTTP request). Because everything is configurable I can easily make changes as needed. The next step is running the test.
Step 4: Run the test
The first thing you have to deal with before running the test is driving enough traffic to tax your server without over-driving the machine running JMeter or saturating the network. This takes some experimentation. Here are some tips:
- Don’t run your test using the JMeter GUI. Use the command line instead.
- Don’t run Elasticsearch on the same machine that runs your JMeter test.
- As mentioned earlier, use a very simple assertion that does as little as possible, such as checking the response header.
- Turn off all Listeners. I’ll give you an approach for gathering and visualizing your test results that will blow those away anyway.
- Don’t exceed the maximum recommended number of threads (users) per test machine, which is 300.
- Use multiple JMeter client machines to drive a higher concurrent load, if needed.
- Make sure your Elasticsearch query is sufficient enough to tax the server.
This last point was a gotcha for us. We simply couldn’t run enough parallel JMeter clients to stress the Elasticsearch cluster. The CPU and RAM on the nodes in the Elasticsearch cluster were barely taxed, but the JMeter client machines were max’d out. Increasing the number of threads didn’t help–that just caused the response times JMeter reported to get longer and longer due to the shortage of resources on the client machines.
The problem was that many of our Elasticsearch queries were returning empty result sets. We had indexed 1.2 million news articles with metadata ranges that were too broad. When we randomized our test data and used that test data to create filter queries, the filters were too narrow, resulting in empty result sets. This was neither realistic nor difficult for the Elasticsearch server to process.
Once we fixed that, we were able to drive our desired load with a single test client and we were able to prove to ourselves that for a given load driven by a single JMeter test client we could handle that load with an acceptable response time using an Elasticsearch cluster consisting of a single load-balancing node and two master/data nodes (two replicas in total). We scaled that linearly by adding another 3 nodes to the cluster (one load-balancer and two master/data nodes) and driving it with an additional JMeter client machine.
Visualizing the Results
When you do this kind of testing it doesn’t take long before you want to visualize the test results. Luckily Elasticsearch has a pretty good offering for doing that called ELK (Elasticsearch, Logstash, & Kibana). In my next post I’ll describe how we used ELK to produce a real-time JMeter test results dashboard.
Using Apache JMeter to load test #Elasticsearch (or anything with a REST API) http://t.co/cOP0kESyl0
RT @jeffpotts01: Using Apache JMeter to load test #Elasticsearch (or anything with a REST API) http://t.co/cOP0kESyl0
RT @jeffpotts01: Using Apache JMeter to load test #Elasticsearch (or anything with a REST API) http://t.co/cOP0kESyl0
RT @jeffpotts01: Using Apache JMeter to load test #Elasticsearch (or anything with a REST API) http://t.co/cOP0kESyl0
RT @jeffpotts01: Using Apache JMeter to load test #Elasticsearch (or anything with a REST API) http://t.co/cOP0kESyl0
RT @jeffpotts01: Using Apache JMeter to load test #Elasticsearch (or anything with a REST API) http://t.co/cOP0kESyl0
RT @jeffpotts01: Using Apache JMeter to load test #Elasticsearch (or anything with a REST API) http://t.co/cOP0kESyl0
Using Apache JMeter to Test Elasticsearch (or any REST API) thx @jeffpotts01 http://t.co/1LCc0k76zB
RT @jeffpotts01: Using Apache JMeter to load test #Elasticsearch (or anything with a REST API) http://t.co/cOP0kESyl0
RT @jeffpotts01: Using Apache JMeter to load test #Elasticsearch (or anything with a REST API) http://t.co/cOP0kESyl0
Using Apache #JMeter to Test #Elasticsearch (or any #REST API) http://t.co/mqyWvhdO6H
RT @jeffpotts01: Using Apache JMeter to load test #Elasticsearch (or anything with a REST API) http://t.co/cOP0kESyl0
RT @mkj6: Using Apache #JMeter to Test #Elasticsearch (or any #REST API) http://t.co/mqyWvhdO6H
“Using Apache JMeter to Test Elasticsearch (or any REST API)” http://t.co/RzyZd0kvju
This is a great descriptive article but I ran into a problem when trying to follow it. The way you set the request body appears to be no longer supported in jmeter 2.12.
If you do not set a “name” for the request parameter you use for the query, no query is sent and if you set a name for it is then appended to the request URL as a GET parameter.
How do you do this now in the current version of jmeter?
I haven’t tried my existing setup with 2.12. Here is a section of my XML that shows what I describe in the article as the part where my request body is provided as the value of a variable:
<collectionprop name="Arguments.arguments">

  <elementprop name="" elementType="HTTPArgument">

    <boolprop name="HTTPArgument.always_encode">false</boolprop>

    <stringprop name="Argument.value">${__eval(${PAGE_GEO_DATES_UNFILTERED_QUERY})}</stringprop>

    <stringprop name="Argument.metadata">=</stringprop>

    <boolprop name="HTTPArgument.use_equals">true</boolprop>

  </elementprop>

</collectionprop>
The value of that variable is read in from a file, as shown here:
<elementprop name="PAGE_GEO_DATES_UNFILTERED_QUERY" elementType="Argument">

  <stringprop name="Argument.name">PAGE_GEO_DATES_UNFILTERED_QUERY</stringprop>

  <stringprop name="Argument.value">${__FileToString(${JSONTEMPLATE_ROOT}/page_geo_dates_query.json,UTF-8,)}</stringprop>

  <stringprop name="Argument.metadata">=</stringprop>

</elementprop>
Hope that helps you figure out what’s going on with your 2.12 setup.
Jeff
Hi,
Your post missing how an important and clever idea you came up with for providing JSON data to the REST API. I presume, the three variables used in the template pageID, GEO_CODE, PUB_DATE come form CSV data file? if not, can you explain how variables get substituted with values for the query? Thanks.
Yes, those values come from the CSV file.
Jeff
By the way, I’ve confirmed that this also works using Apache JMeter 2.13. I did not have to make any changes for this to work with 2.13.
defiantly jmeter is best tool to automate rest apis. jmeter CSV approach helps to automate apis quickly. jmeter plus maven: adding jmeter maven plugin helps to integrate rest api test cases to build and this provides nice HTML interactive report to publish the results.