
In my last blog post I showed how to use Apache JMeter to run a load test against Elasticsearch or anything with a REST API. One of my recommendations was to turn off all of the Listeners so that valuable test client resources are not wasted on aggregating test results. So what’s the best way to analyze your load test results?
Our load test was running against Elasticsearch which just happens to have a pretty nice tool set for ingesting, analyzing, and reporting on any kind of data you might find in a log file. It’s called ELK and it stands for Elasticsearch, Logstash, and Kibana. Elasticsearch is a distributed, scalable search engine and document oriented NoSQL store. Logstash is a log parser that can send log data to various outputs. Kibana is a tool for defining dashboards that contain charts, graphs, and tables based on data stored in Elasticsearch.
It is really quite easy to use ELK to create a dashboard that aggregates and displays Apache JMeter test results in realtime. Here’s how.
Step One: Configure Apache JMeter to Create a CSV File
Another recommendation in my last post was to use the Apache JMeter GUI only for testing and to run your load test from the command line. For example, this runs my test named “Basic Elasticsearch Test.jmx” from the command line and writes the results to results.csv:
/opt/apache/jmeter/apache-jmeter-2.11/bin/jmeter -n -t Basic\ Elasticsearch\ Test.jmx -l ./results.csv
The results.csv file will get fed to Logstash and ultimately Elasticsearch so it can be reported on by Kibana. The Apache JMeter user.properties file is used to specify what gets written to results.csv. Here is a snippet from mine:
(Can’t see the code? Click here.)
Pay attention to that timestamp format. You want your Apache JMeter timestamp to match the default date format in Elasticsearch.
Step Two: Configure and Run Logstash
Next, download and unpack Logstash. It will run on the same machine as your test client box (or on a box with file access to the results.csv file that JMeter is going to create). It also needs to be able to get to Elasticsearch over HTTP.
There are two steps to configuring Logstash. First, Logstash needs to know about the results.csv file and where to send the log data. The second part is that Elasticsearch needs a type mapping so it understands the data types of the incoming JSON that Logstash will be sending to it. Let’s look at the Logstash config first.
The Logstash configuration is kind of funky, but there’s not much to it. Here’s mine:
(Can’t see the code? Click here.)
The “input” part tells Logstash where to find the JMeter results file.
The “if” statement in the “filter” part looks for the header row in the CSV file and discards it if it finds it, otherwise, it tells Logstash what columns are in the CSV.
The “output” part tells Logstash what to do with the data. In this case we’ll use the elasticsearch_http plugin to send the data to Elasticsearch. There is also one that uses the native API but when you use that, you have to use a specific version combination of Logstash and Elasticsearch.
A quick side note: In our case, we were running a load test against an Elasticsearch cluster. We use Marvel to report on the health of that cluster. To avoid affecting production performance, Marvel sends its data to a separate monitoring cluster. Similarly, we don’t want to send a bunch of test result data to the production cluster that is being tested, so we configured Logstash to send its data to the monitoring cluster as well.
That’s all the config that’s needed for this particular exercise.
Here are a couple of Logstash tips. First, if you need to see what’s going on you can add a sysout to the configuration by adding this line between ‘output {‘ and ‘elasticsearch_http {‘ before starting logstash:
stdout { codec => rubydebug }
The second tip is about re-running Logstash and forcing it to re-parse a log file it has already read. Logstash remembers where it is in the log. It does this by writing a “sincedb” file. So if you need to re-parse the results.csv file, clear out your sincedb files (mine live in ~/.sincedb*). You may also have to add “start_position => beginning” to your Logstash config on the line immediately following the path statement.
Okay, Logstash is ready to read the Apache JMeter CSV and send it to Elasticsearch. Now Elasticsearch needs to have an index and a type mapping ready to hold the log data. If you’ve spent any time at all with Elasticsearch you should be familiar with creating a type mapping. In this case, what you want to do is create a type mapping template. That way, Logstash can create an index based on the current date, and it will use the correct type mapping each time.
Here is the type mapping I used:
(Can’t see the code? Click here.)
Now Logstash is configured to read the data and Elasticsearch is ready to persist it. You can test this at this point and verify that the data is going all the way to Elasticsearch. Start up Logstash like this:
/opt/elasticsearch/logstash-1.4.2/bin/logstash -f ./jmeter-results.conf
If it looks happy, go start your load test. Then use Sense (part of Marvel) or a similar tool to inspect your Elasticsearch index.
Step 3: Visualize the Results
Now it is time to visualize all of those test results coming from the load test. To do that, go download and unpack Kibana. I followed a tip in this blog post and unpacked it into $ES_HOME/plugins/kibana/_site on my monitoring cluster but you could use some other HTTP server if you’d rather.
Now open a browser and go to Kibana. You can link to a Logstash dashboard, a sample dashboard, an unconfigured dashboard, or a blank dashboard. Pick one and start playing with it. Once you get the hang of it, create your JMeter Dashboard starting from a blank dashboard. Here’s what our dashboard looked like when it was done:
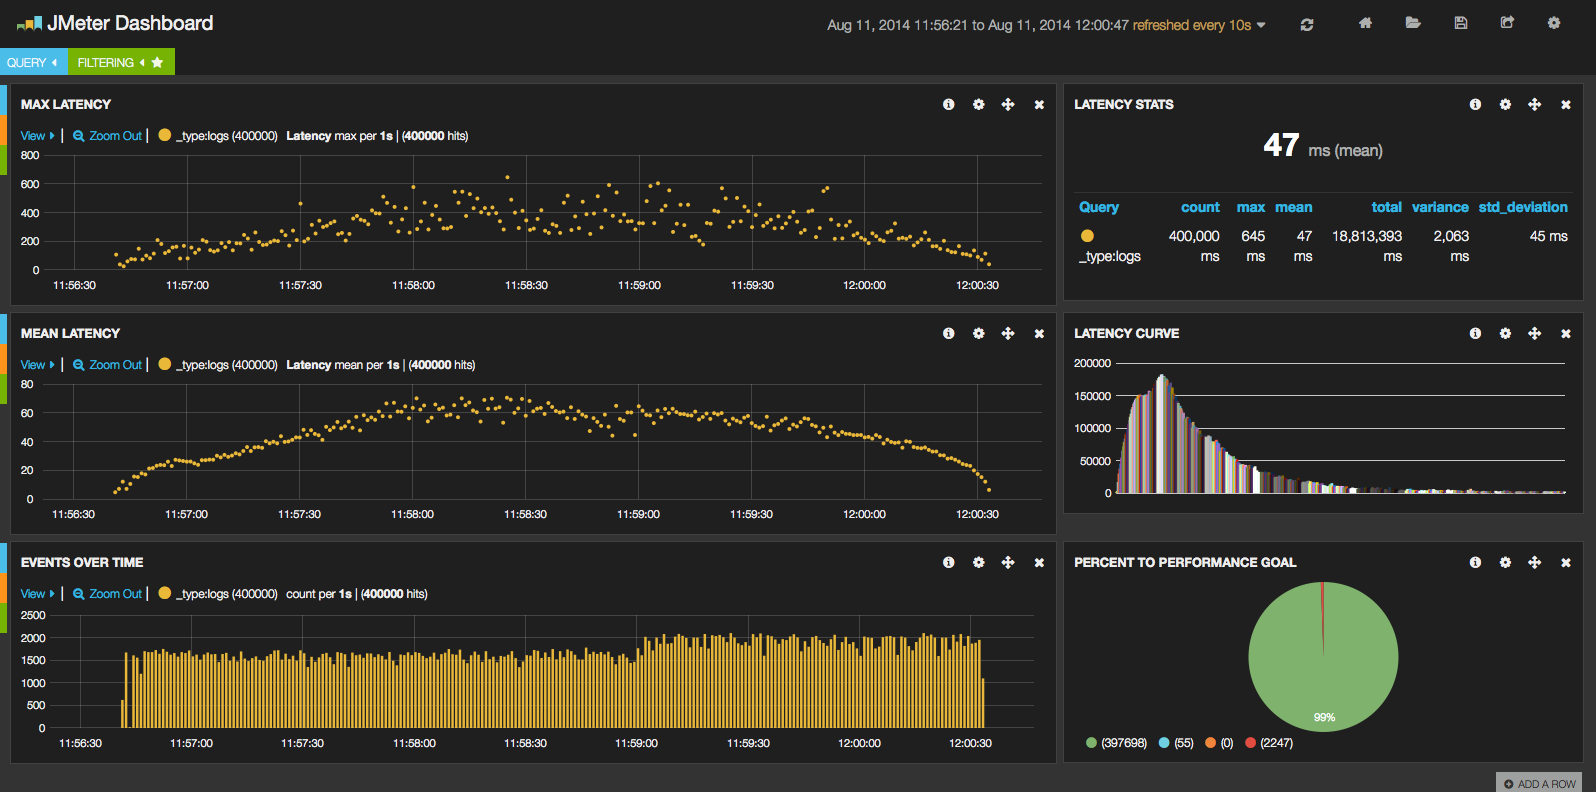 Click to see the screenshot in all of its glory.
Using Logstash and Kibana we can see, in realtime, the throughput our Apache JMeter test is driving (bottom left) and a few different panels breaking down response latency. You can add whatever makes sense to you and your team. For example, we want all of our responses to come back within 250 ms, so the chart on the bottom right-hand corner shows how we’re doing against that goal for this test run.
One gotcha to be aware of. By default, Kibana looks at the Elasticsearch timestamp. But that’s the time that Logstash indexed the content, not the actual time that the HTTP request came back to Apache JMeter. That time gap could be small if you are running Logstash while your test is running and your machine has sufficient resources, or it could be very large if you wait to parse your test results for some time after the test run. Luckily, the timestamp field that Kibana uses is configurable so make sure all of your graphs are charting the appropriate timestamp field, which is the “time” field that JMeter writes to the CSV file.
Using #Elasticsearch, Logstash, and Kibana to visualize Apache JMeter test results http://t.co/l3cBVriIud
RT @jeffpotts01: Using #Elasticsearch, Logstash, and Kibana to visualize Apache JMeter test results http://t.co/l3cBVriIud
RT @jeffpotts01: Using #Elasticsearch, Logstash, and Kibana to visualize Apache JMeter test results http://t.co/l3cBVriIud
RT @jeffpotts01: Using #Elasticsearch, Logstash, and Kibana to visualize Apache JMeter test results http://t.co/l3cBVriIud
RT @jeffpotts01: Using #Elasticsearch, Logstash, and Kibana to visualize Apache JMeter test results http://t.co/l3cBVriIud
RT @jeffpotts01: Using #Elasticsearch, Logstash, and Kibana to visualize Apache JMeter test results http://t.co/l3cBVriIud
RT @jeffpotts01: Using #Elasticsearch, Logstash, and Kibana to visualize Apache JMeter test results http://t.co/l3cBVriIud
RT @jeffpotts01: Using #Elasticsearch, Logstash, and Kibana to visualize Apache JMeter test results http://t.co/l3cBVriIud
RT @jeffpotts01: Using #Elasticsearch, Logstash, and Kibana to visualize Apache JMeter test results http://t.co/l3cBVriIud
Using Elasticsearch, Logstash, and Kibana to visualize Apache JMeter test results
http://t.co/yK3HnmaKYc
Thanks for this great article, that’s a very good idea. Could you explain how you do the panel with the goal of 250 ms please ? Type of panel and where to put the goal of 250.
Absolutely cool!
how to match Apache JMeter timestamp to the default date format in Elasticsearch?
srikanth, the blog post points to a user.properties file. That file is used to specify the format of the results.csv. Specifically, the line that formats the time stamp like Elasticsearch expects is:
jmeter.save.saveservice.timestamp_format=yyyy-MM-dd'T'HH:mm:ss.SSSZJeff
Hey could you upload your Kibana configuration please? I have no clue how to build a dashboard like yours! Especially Latency and the Goal panel.. please help me
Hi Jeff. I set all the jmeter.save options in the jmeter.properties file. Do I have to also set them in the user.properties file alongwith the ES_HOST properties??
Great stuff!
I want to create same dashboard as you mentioned in your post.
Do you have any other article for creating jmeter dashboard?
or can you please share your dashboard configuration?
By the way, I’ve confirmed that this also works using Apache JMeter 2.13, Elasticsearch 1.5.1, Logstash 1.5.0.rc2, and Kibana 4.0.1 (with Shield 1.2.0). The dashboard has to be recreated with Kibana 4, however, because Kibana 3 dashboards are not compatible with Kibana 4.
To get this working I had to do 2 changes
one in jmeter – jmeter.save.saveservice.timestamp_format=yyyy-MM-dd’T’HH:mm:ss.SSSZZ
and the other in ES mapping
“time”: {
“type”: “date”,
“format”: “yyyy-MM-dd’T’HH:mm:ss.SSSZZ”
}
Not sure why it wouldn’t work with the settings you specified. It was throwing error in ElasticSearch indexing. If I set someother format, it wouldn’t treat the time as time stamp. Posting it here so that others get benefited in case they face the same issue.
Great article indeed ! Followed your steps blindly to get this working and is helping a lot in my performance analysis.
Hi! Could you add just a few more details on how to get the template configuration into elasticsearch? As an elasticsearch noob, I’m pretty much lost :-/
Hi ,
can you please let me know where is the dynamic mapping location for placing the above mapping json
You can either POST the mapping template to your Elasticsearch cluster using curl or Sense or you can place it on your file system and configure logstash to load it for you. For example, you can name your template jmeter-results-mapping.json, then add these lines to your elasticsearch output config:
template => "/some/path/code/es-test/logstash/jmeter-results-mapping.json"template_name => "logstash-jmeter-results"
template_overwrite => false
Either way works, it is up to you which approach to use.
Lars,
You can configure the elasticsearch output in the logstash config to manage the template for you. See my other comment on this.
Alternatively, you can just post the template to Elasticsearch using Sense or curl.
It would be POST /_template/logstash-jmeter-results and then the JSON that I linked to as the mapping template.
Jeff
How can you have the first row parsed as the column headings, and then offset the first line from being indexed?
Eric,
The lines in the logstash conf that look like this:
if ([message] =~ "responseCode") {

  drop { }
…tell logstash to ignore the header row (because the regular expression matches one of the column headings.
So logstash ignores the header row and then relies you to define the columns.
Jeff
I am trying to configure the user.properties on windows machine
/Users/jpotts/Documents/code/es-test/tests/jsontemplates
What is JSON template is this particular to elasticsearch
Very cool. Not yet tried, but could it work with data generated from JmeterPlugin server agent?
I am not familiar with the JMeter Plugin server agent, but if it can produce a log file, logstash can index it into Elasticsearch.
We are trying to build dashboards in Kibana by loading data into ES. Is there a way to perform a load testing of this dashboard report using jmeter?
JMeter issues HTTP requests. Kibana dashboards have URLs. Therefore, you can invoke Kibana dashboards from JMeter. However, depending on what you want to do, you might want to take a look at a testing tool that’s actually going to use a browser window to click links. Selenium is a popular choice.
Hi Jeff, Thanks for the wonderful post. I was able to follow the steps to configure all components however, i’m having challenges to create the visualizations since some the fields have duplicate types which i’m unable to correct. Could you please post few steps on how (which columns from JMeter stats) you created the Latency graphs & stats and events over time on Dashboard?