Month: September 2014

What we’re dying to hear at Alfresco Summit

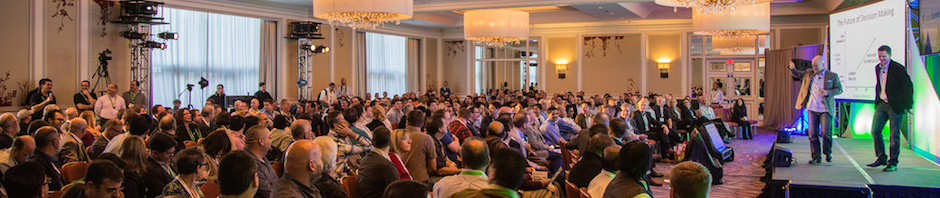
For the first time, ever, I will not be in attendance at this year’s annual Alfresco conference. I’m going to miss catching up with old friends, meeting new ones, learning, and sharing stories.

I’m also going to miss hearing what Alfresco has planned. Now, more than ever, Alfresco needs to inspire. As I won’t be there I need the rest of you to go to Alfresco Summit and take good notes for me. Here’s what you should be listening for…

What Are You Doing With the Money, Doug?

At last year’s conference Alfresco CEO, Doug Dennerline, made a quip about how much fun he was having spending all of the money Alfresco had amassed prior to his arrival. Now he’s secured another round of funding.

I think partners, customers, and the community want to hear what the specific plans are for all of that cash. In a Q&A with the community, Doug said he felt like there were too few sales people for a company the size of Alfresco’s. In the old days, Alfresco had an “inbound” model, where people would try the free stuff and call a sales person when they were ready for support. Doug is inverting that and going with a traditional “outbound” model. That obviously takes cash, and it may be critical for the company to grow to where Doug and the investors would like, but it is rather uninspiring to the rest of us. Where are the bold, audacious plans? Where is the disruption? Which brings me to my next theme to listen for…

Keep Alfresco Weird

Remember when Alfresco was different? It was open source. It was lightweight. It appealed to developers and consultants because it could approximate what a Documentum aircraft carrier could do but it had the agility of a speedboat. And, perhaps above all, it was cheap.

Now it feels like that free-wheeling soul, that maverick of ECM, that long-haired hippy love-child, born of a one-night stand between ECM and Linux, is looking in the mirror and realizing it has slowly become its father.

Maybe in some ways, growing up was necessary. Alfresco certainly feels more stable than years past. But what I want to hear is that the scrappiness is still there. I want to see some features that competitors haven’t thought of yet. I want to look into the eyes of the grown-up Alfresco and see (and believe) that the mischievous flicker of youth is still glowing, ready to shake things up.

Successfully Shoot the Gap Or Get Crushed?

Alfresco is in a unique position. There are the cloud-only players on one side who are beating Alfresco on some dimensions (ease-of-use, flawless file sync, ubiquity) and are, at least for now, losing to Alfresco on other dimensions (on-premises capability, security, business relevance). On the other side, you’ve got legacy players. Alfresco is still more nimble than they are, but with recent price increases, Alfresco can no longer beat them on price alone. That gap is either Alfresco’s opportunity or its demise.

Every day those cloud-only players add business-relevant functionality that their (huge) user base demands. They’ve got endless cash. And dear Lord, the marketing. If I have to read one more bullshit TechCrunch article about how Aaron Levie “invented” the alternative to ECM, I’m going to lose it. Bottom-line is that the cloud-only guys have their sites set on Alfresco’s bread-and-butter.

And those legacy vendors, the ones Alfresco initially disrupted with an open source model, are not only showing signs of life, but in some cases are actually introducing innovative functionality. If Alfresco turns away from the low-cost leader strategy they miss out on a huge lever needed to unseat incumbent vendors. “Openness” may not be enough to win in a toe-to-toe battle of function points.

So what exactly is the strategy for successfully shooting the gap? We’ve all heard the plans Alfresco has around providing content-centric business apps as SaaS offerings. That sounds great for the niche markets interested in those offerings. But that sounds more like one leg of the strategy, not the whole thing. I don’t think you’re fighting off Google, Microsoft, and Amazon with a few new SaaS offerings a year.

So Take Good Notes For Me

Alfresco has had two years to establish the office in the valley, to get their shit together, and to start kicking ass again. What I’m hoping is that at this year’s Alfresco Summit, they will give us credible details about how that $45 million is going to be spent in such a way as to make all of the customers, partners, employees, and community members glad they bet their businesses and careers on what was once an innovative, game-changing, start-up called Alfresco.

Take good notes and report back!

Using Elasticsearch, Logstash, and Kibana to visualize Apache JMeter test results

In my last blog post I showed how to use Apache JMeter to run a load test against Elasticsearch or anything with a REST API. One of my recommendations was to turn off all of the Listeners so that valuable test client resources are not wasted on aggregating test results. So what’s the best way to analyze your load test results?

Our load test was running against Elasticsearch which just happens to have a pretty nice tool set for ingesting, analyzing, and reporting on any kind of data you might find in a log file. It’s called ELK and it stands for Elasticsearch, Logstash, and Kibana. Elasticsearch is a distributed, scalable search engine and document oriented NoSQL store. Logstash is a log parser that can send log data to various outputs. Kibana is a tool for defining dashboards that contain charts, graphs, and tables based on data stored in Elasticsearch.

It is really quite easy to use ELK to create a dashboard that aggregates and displays Apache JMeter test results in realtime. Here’s how.

Step One: Configure Apache JMeter to Create a CSV File

Another recommendation in my last post was to use the Apache JMeter GUI only for testing and to run your load test from the command line. For example, this runs my test named “Basic Elasticsearch Test.jmx” from the command line and writes the results to results.csv:

/opt/apache/jmeter/apache-jmeter-2.11/bin/jmeter -n -t Basic\ Elasticsearch\ Test.jmx -l ./results.csv

The results.csv file will get fed to Logstash and ultimately Elasticsearch so it can be reported on by Kibana. The Apache JMeter user.properties file is used to specify what gets written to results.csv. Here is a snippet from mine:

(Can’t see the code? Click here.)

Pay attention to that timestamp format. You want your Apache JMeter timestamp to match the default date format in Elasticsearch.

Step Two: Configure and Run Logstash

Next, download and unpack Logstash. It will run on the same machine as your test client box (or on a box with file access to the results.csv file that JMeter is going to create). It also needs to be able to get to Elasticsearch over HTTP.

There are two steps to configuring Logstash. First, Logstash needs to know about the results.csv file and where to send the log data. The second part is that Elasticsearch needs a type mapping so it understands the data types of the incoming JSON that Logstash will be sending to it. Let’s look at the Logstash config first.

The Logstash configuration is kind of funky, but there’s not much to it. Here’s mine:

(Can’t see the code? Click here.)

The “input” part tells Logstash where to find the JMeter results file.

The “if” statement in the “filter” part looks for the header row in the CSV file and discards it if it finds it, otherwise, it tells Logstash what columns are in the CSV.

The “output” part tells Logstash what to do with the data. In this case we’ll use the elasticsearch_http plugin to send the data to Elasticsearch. There is also one that uses the native API but when you use that, you have to use a specific version combination of Logstash and Elasticsearch.

A quick side note: In our case, we were running a load test against an Elasticsearch cluster. We use Marvel to report on the health of that cluster. To avoid affecting production performance, Marvel sends its data to a separate monitoring cluster. Similarly, we don’t want to send a bunch of test result data to the production cluster that is being tested, so we configured Logstash to send its data to the monitoring cluster as well.

That’s all the config that’s needed for this particular exercise.

Here are a couple of Logstash tips. First, if you need to see what’s going on you can add a sysout to the configuration by adding this line between ‘output {‘ and ‘elasticsearch_http {‘ before starting logstash:

stdout { codec => rubydebug }

The second tip is about re-running Logstash and forcing it to re-parse a log file it has already read. Logstash remembers where it is in the log. It does this by writing a “sincedb” file. So if you need to re-parse the results.csv file, clear out your sincedb files (mine live in ~/.sincedb*). You may also have to add “start_position => beginning” to your Logstash config on the line immediately following the path statement.

Okay, Logstash is ready to read the Apache JMeter CSV and send it to Elasticsearch. Now Elasticsearch needs to have an index and a type mapping ready to hold the log data. If you’ve spent any time at all with Elasticsearch you should be familiar with creating a type mapping. In this case, what you want to do is create a type mapping template. That way, Logstash can create an index based on the current date, and it will use the correct type mapping each time.

Here is the type mapping I used:

(Can’t see the code? Click here.)

Now Logstash is configured to read the data and Elasticsearch is ready to persist it. You can test this at this point and verify that the data is going all the way to Elasticsearch. Start up Logstash like this:

/opt/elasticsearch/logstash-1.4.2/bin/logstash -f ./jmeter-results.conf

If it looks happy, go start your load test. Then use Sense (part of Marvel) or a similar tool to inspect your Elasticsearch index.

Step 3: Visualize the Results

Now it is time to visualize all of those test results coming from the load test. To do that, go download and unpack Kibana. I followed a tip in this blog post and unpacked it into $ES_HOME/plugins/kibana/_site on my monitoring cluster but you could use some other HTTP server if you’d rather.

Now open a browser and go to Kibana. You can link to a Logstash dashboard, a sample dashboard, an unconfigured dashboard, or a blank dashboard. Pick one and start playing with it. Once you get the hang of it, create your JMeter Dashboard starting from a blank dashboard. Here’s what our dashboard looked like when it was done:

Apache JMeter Results DashboardClick to see the screenshot in all of its glory.

Using Logstash and Kibana we can see, in realtime, the throughput our Apache JMeter test is driving (bottom left) and a few different panels breaking down response latency. You can add whatever makes sense to you and your team. For example, we want all of our responses to come back within 250 ms, so the chart on the bottom right-hand corner shows how we’re doing against that goal for this test run.

One gotcha to be aware of. By default, Kibana looks at the Elasticsearch timestamp. But that’s the time that Logstash indexed the content, not the actual time that the HTTP request came back to Apache JMeter. That time gap could be small if you are running Logstash while your test is running and your machine has sufficient resources, or it could be very large if you wait to parse your test results for some time after the test run. Luckily, the timestamp field that Kibana uses is configurable so make sure all of your graphs are charting the appropriate timestamp field, which is the “time” field that JMeter writes to the CSV file.

Using Apache JMeter to Test Elasticsearch (or any REST API)

I’m helping a client streamline their Web Content Management processes, part of which includes moving from a static publishing model to a dynamic content-as-a-service model. I’ll blog more on that some other time. What I want to talk about today is how we used Apache JMeter to validate that Elasticsearch, which is a core piece of infrastructure in the solution, could handle the load.

Step 1. Find some test data to index with Elasticsearch

Despite being a well-known commerce site that most of my U.S. readers would be familiar with, my client’s site’s content requirements are relatively modest. On go-live, the content service might have 10 or 20 thousand content objects at most. But we wanted to test using a data set that was much larger than that.

We set out to find a real world data set with at least 1 million records, preferably already in JSON, as that’s what Elasticsearch understands natively. Amazon Web Services has a catalog of public data sets. The Enron Email data set looked most promising.

We ended up going with a news database with well over a million articles because the client already had an app that would convert the news articles into JSON and index them in Elasticsearch. By using the Elasticsearch Java API and batching the index operations using its bulk API we were able to index 1.2 million news articles in a matter of minutes.

Step 2: Choosing the Testing Tool & Approach

We looked at a variety of tools for running a load test against a REST API including things like siege, nodeload, Apache ab, and custom scripts. We settled on Apache JMeter because it seemed like the most full-featured option, plus I already had some familiarity with the tool.

For this particular exercise, we wanted to see how hard we could push Elasticsearch while keeping response time within an acceptable window. Once we established our maximum load with a minimal Elasticsearch cluster, we would then prove that we could scale out roughly linearly.

Step 3: Defining the Test in Apache JMeter

JMeter tests are defined in JMX files. The easiest way to create a JMX file is to use the JMeter GUI. Here’s how I defined the basic load test JMX file…

First, I created a thread group. Think of this like a group of test users. The thread group defines how many simultaneous users will be running the test, how fast the ramp-up will be, and how many loops through the test each user will make. You can see by the screenshot below that I used parameters for each of these to make it easier to change the settings through configuration.

JMeter Thread GroupWithin the thread group I added some HTTP Request Defaults. This defines my Elasticsearch host and port once so I don’t have to repeat myself across every HTTP request that’s part of the test.

JMeter HTTP Request DefaultsNext are my User Defined Variables. These define values for the variables in my test. Look at the screenshot below:

JMeter User Defined VariablesYou’ll notice that there are three different kinds of variables in this list:

  1. Hard-coded values, like 50 for rampUp and 2000 for loop. These likely won’t change across test runs.
  2. Properties, like thread, ES_HOST, and ES_PORT. These point to properties in my JMeter user.properties file.
  3. FileToString values, like for PAGE_GEO_QUERY. These point to Elasticsearch query templates that live in JSON files on the file system. JMeter is going to read in those templates and use them for the body of HTTP requests. More on the query templates in a minute.

The third configuration item in my test definition is a CSV Data Set Config. I didn’t want my Elasticsearch queries to use the same values on every HTTP request. Instead I wanted that data to be randomized. Rather than asking JMeter to randomize the data, I created a CSV file with randomized data. Reading data from a CSV to use for the test run is less work for JMeter to do and gives me a repeatable, but random, set of data for my tests.

JMeter CSV Data Set ConfigYou can see that the filename is prefaced with “${CSVDATA_ROOT}”, which is a property declared in the User Defined Variables. The value of it resides in my JMeter user.properties file and tells JMeter where to find the CSV data set.

Here is a snippet of my user.properties file:
ES_HOST=127.0.0.1
ES_PORT=9200
ES_INDEX=content-service-content
ES_TYPE=wcmasset
THREAD=200
JSONTEMPLATE_ROOT=/Users/jpotts/Documents/metaversant/clients/swa/code/es-test/tests/jsontemplates
CSVDATA_ROOT=/Users/jpotts/Documents/metaversant/clients/swa/code/es-test/tests/data

Next comes the actual HTTP requests that will be run against Elasticsearch. I added one HTTP Request Sampler for each Elasticsearch query. I have multiple HTTP Request Samplers defined–I typically leave all but one disabled for the load test depending on the kind of load I’m trying to test.

JMeter HTTP RequestYou can see that I didn’t have to specify the server or port because the HTTP Request Defaults configuration took care of that for me. I specified the path, which is the Elasticsearch URL, and the body of the request, which resides in a variable. In this example, the variable is called PAGE_GEO_DATES_UNFILTERED_QUERY. That variable is defined in User Defined Variables and it points to a FileToString value that resolves to a JSON file containing the Elasticsearch query.

Okay, so what are these query templates? You’ve probably used curl or Sense (part of Marvel) to run Elasticsearch queries. A query template is that same JSON with replacement variables instead of actual values to search for. JMeter will merge the test data from the randomized test data CSV with the replacement variables in the query template, and use the result as the body of the HTTP request.

Here’s an example of a query template that runs a filtered query with four replacement variables used as filter values:

(Can’t see the code? Click here)

JMeter lets you inspect the response that comes back from the HTTP Request using assertions. However, the more assertions you have, the more work JMeter has to do, so it is recommended that you have as few as possible when doing a load test. In my test, I added a single assertion for each HTTP Request that looks only at the response header to make sure that I am getting back JSON from the server.
JMeter Response AssertionJMeter provides a number of Listeners that summarize the responses coming back from the test. You may find things like the Assertion Results, View Results Tree, and Summary Report very helpful while you are writing and testing your JMX file in the JMeter GUI, but you will want to make sure that all of your Listeners are completely disabled when running your load test for real.

At the end of this step I’ve got a repeatable test that will run 400,000 queries against Elasticsearch (that’s 200 threads x 2,000 loops x 1 enabled HTTP request). Because everything is configurable I can easily make changes as needed. The next step is running the test.

Step 4: Run the test

The first thing you have to deal with before running the test is driving enough traffic to tax your server without over-driving the machine running JMeter or saturating the network. This takes some experimentation. Here are some tips:

  • Don’t run your test using the JMeter GUI. Use the command line instead.
  • Don’t run Elasticsearch on the same machine that runs your JMeter test.
  • As mentioned earlier, use a very simple assertion that does as little as possible, such as checking the response header.
  • Turn off all Listeners. I’ll give you an approach for gathering and visualizing your test results that will blow those away anyway.
  • Don’t exceed the maximum recommended number of threads (users) per test machine, which is 300.
  • Use multiple JMeter client machines to drive a higher concurrent load, if needed.
  • Make sure your Elasticsearch query is sufficient enough to tax the server.

This last point was a gotcha for us. We simply couldn’t run enough parallel JMeter clients to stress the Elasticsearch cluster. The CPU and RAM on the nodes in the Elasticsearch cluster were barely taxed, but the JMeter client machines were max’d out. Increasing the number of threads didn’t help–that just caused the response times JMeter reported to get longer and longer due to the shortage of resources on the client machines.

The problem was that many of our Elasticsearch queries were returning empty result sets. We had indexed 1.2 million news articles with metadata ranges that were too broad. When we randomized our test data and used that test data to create filter queries, the filters were too narrow, resulting in empty result sets. This was neither realistic nor difficult for the Elasticsearch server to process.

Once we fixed that, we were able to drive our desired load with a single test client and we were able to prove to ourselves that for a given load driven by a single JMeter test client we could handle that load with an acceptable response time using an Elasticsearch cluster consisting of a single load-balancing node and two master/data nodes (two replicas in total). We scaled that linearly by adding another 3 nodes to the cluster (one load-balancer and two master/data nodes) and driving it with an additional JMeter client machine.

Visualizing the Results

When you do this kind of testing it doesn’t take long before you want to visualize the test results. Luckily Elasticsearch has a pretty good offering for doing that called ELK (Elasticsearch, Logstash, & Kibana). In my next post I’ll describe how we used ELK to produce a real-time JMeter test results dashboard.